.png)

Context
Our client was an industrial supplies manufacturer based in the midwest US, with approximately $150 million in annual revenue. The company, a mid-market player in its sector, had a lean finance team responsible for all reporting and analysis. It had previously been a division of a larger conglomerate and was still relying on legacy Excel-based processes for key financial reports. In particular, its FP&A analyst produced a monthly P&L variance analysis comparing the company’s actual performance to its budget, which was a critical part of the board reporting package. Additionally, on a quarterly basis, the team prepared a similar variance analysis comparing results to the prior year’s performance.
At the time we engaged with the client, this variance reporting process was entirely manual and highly time-consuming. A single FP&A analyst owned the process end-to-end, gathering data from multiple systems and spreadsheets to compute the variances. This effort consumed a significant portion of the analyst’s time each month, often leaving little capacity for deeper analysis or strategic insights. The manual nature of the workflow also carried the risk of inconsistencies or errors, especially under tight deadlines to assemble the board deck. Recognizing these challenges, the Finance leadership sought to streamline the variance analysis process so the analyst could focus on more value-added activities.
Objectives
The variance analysis process was divided into two major steps, both performed manually by the FP&A analyst and consuming significant time each month. In Step 1, the analyst prepared the numerical variance calculations for the P&L, this step usually takes about 2.5-3.5 days each month between gathering data, updating the calculation workbooks, and verifying the outputs:
- Actuals preparation: The analyst mapped the monthly trial balance accounts to the budget’s P&L line items in a spreadsheet. This produced a set of actuals in the same format as the budget (by P&L line) and took roughly half a day each month.
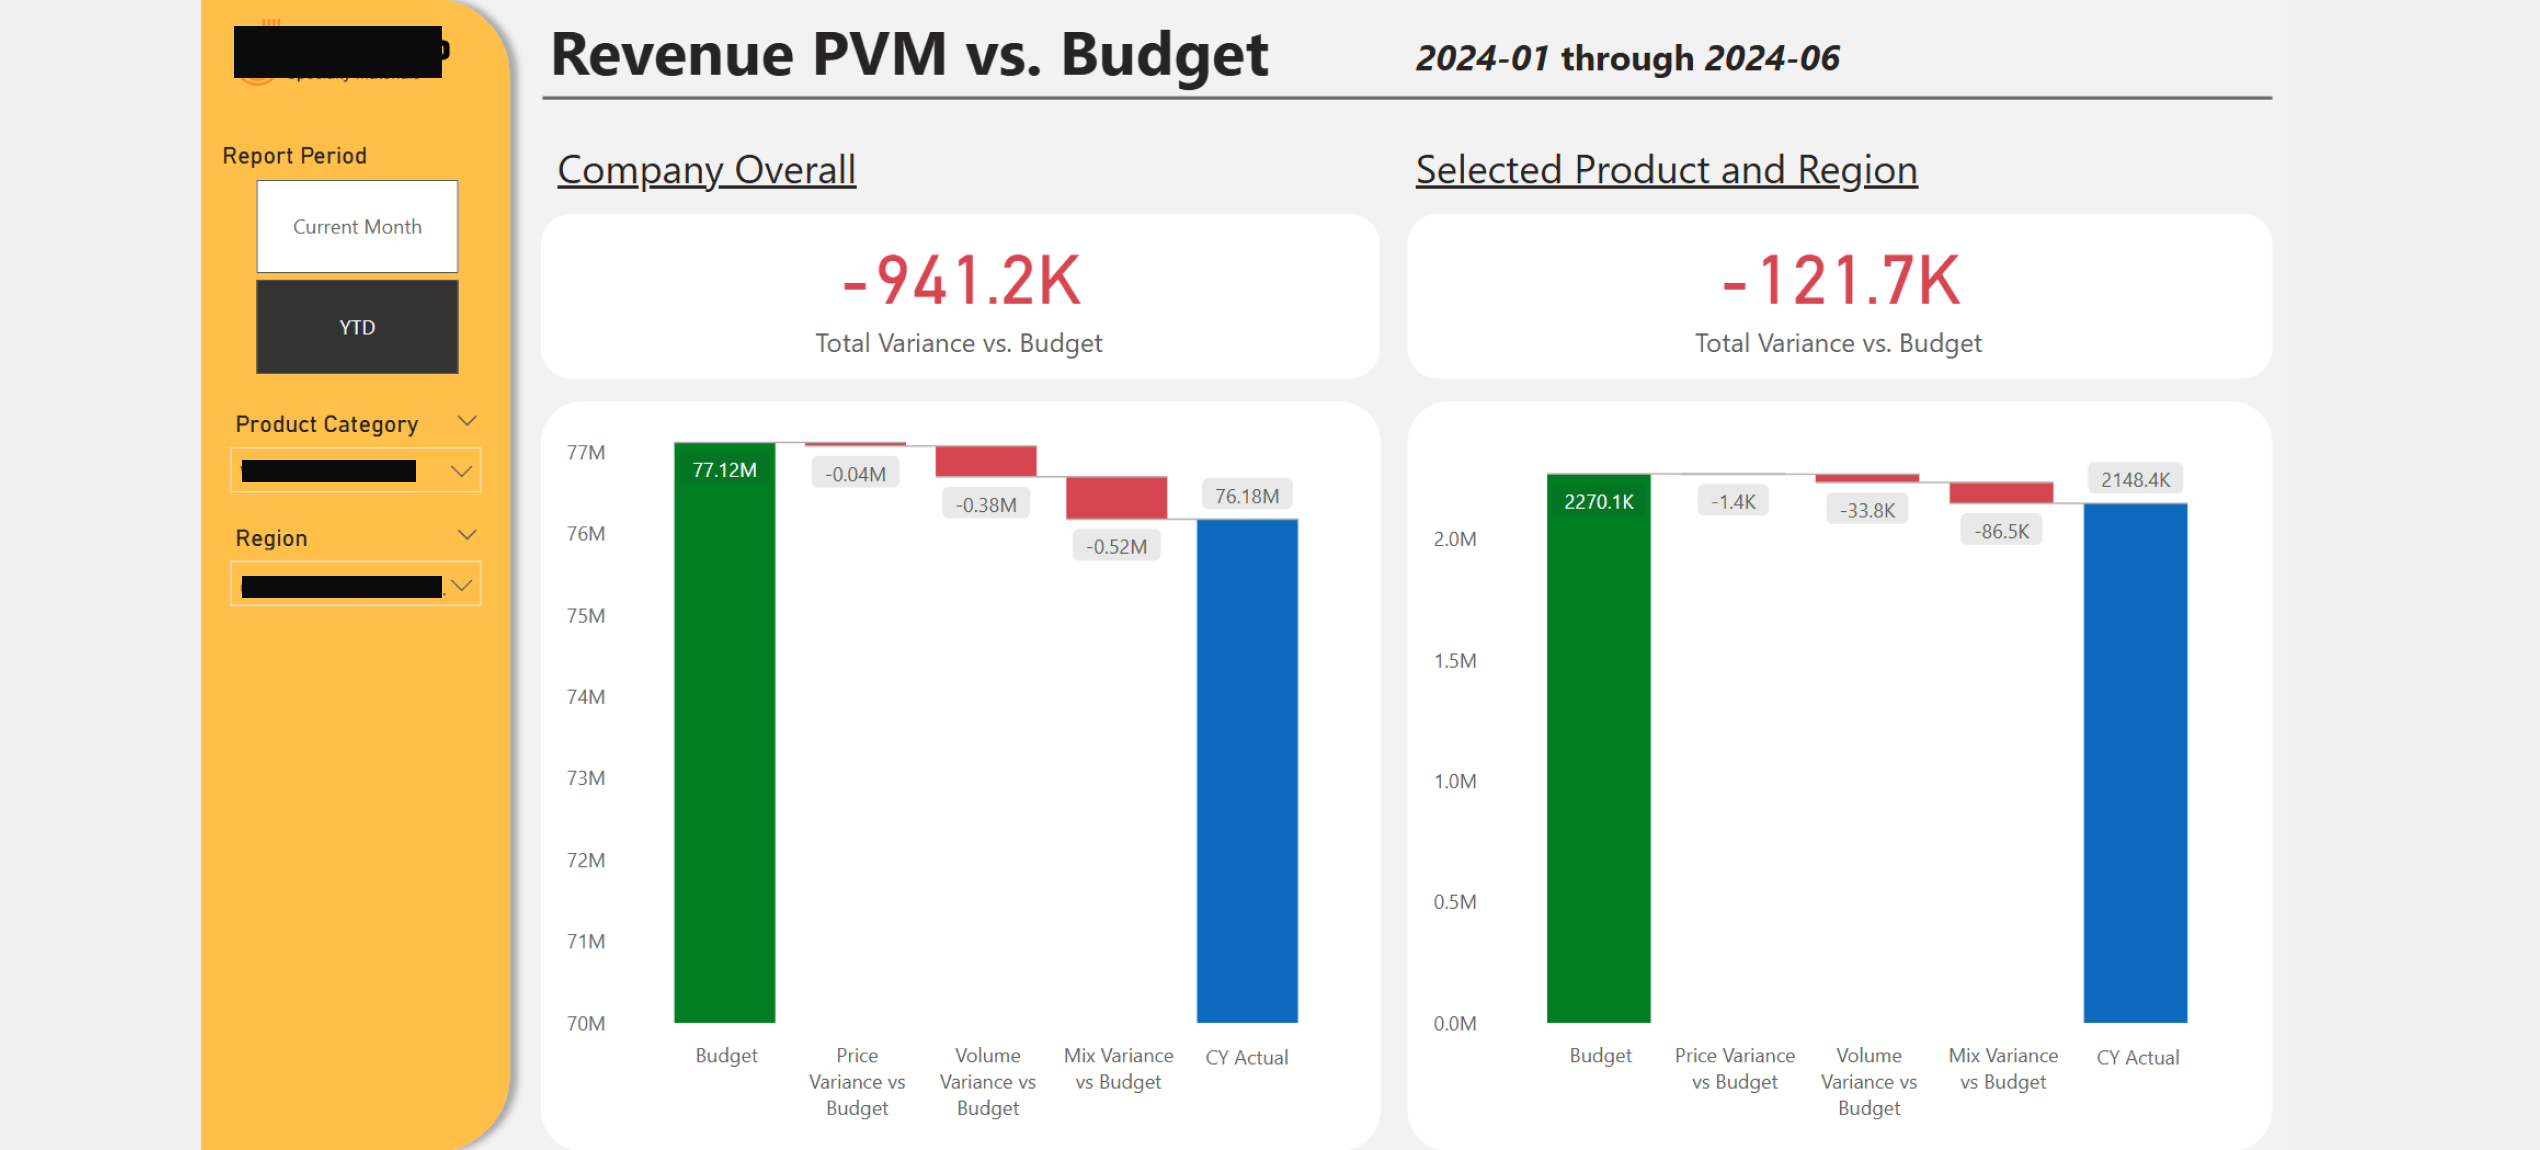
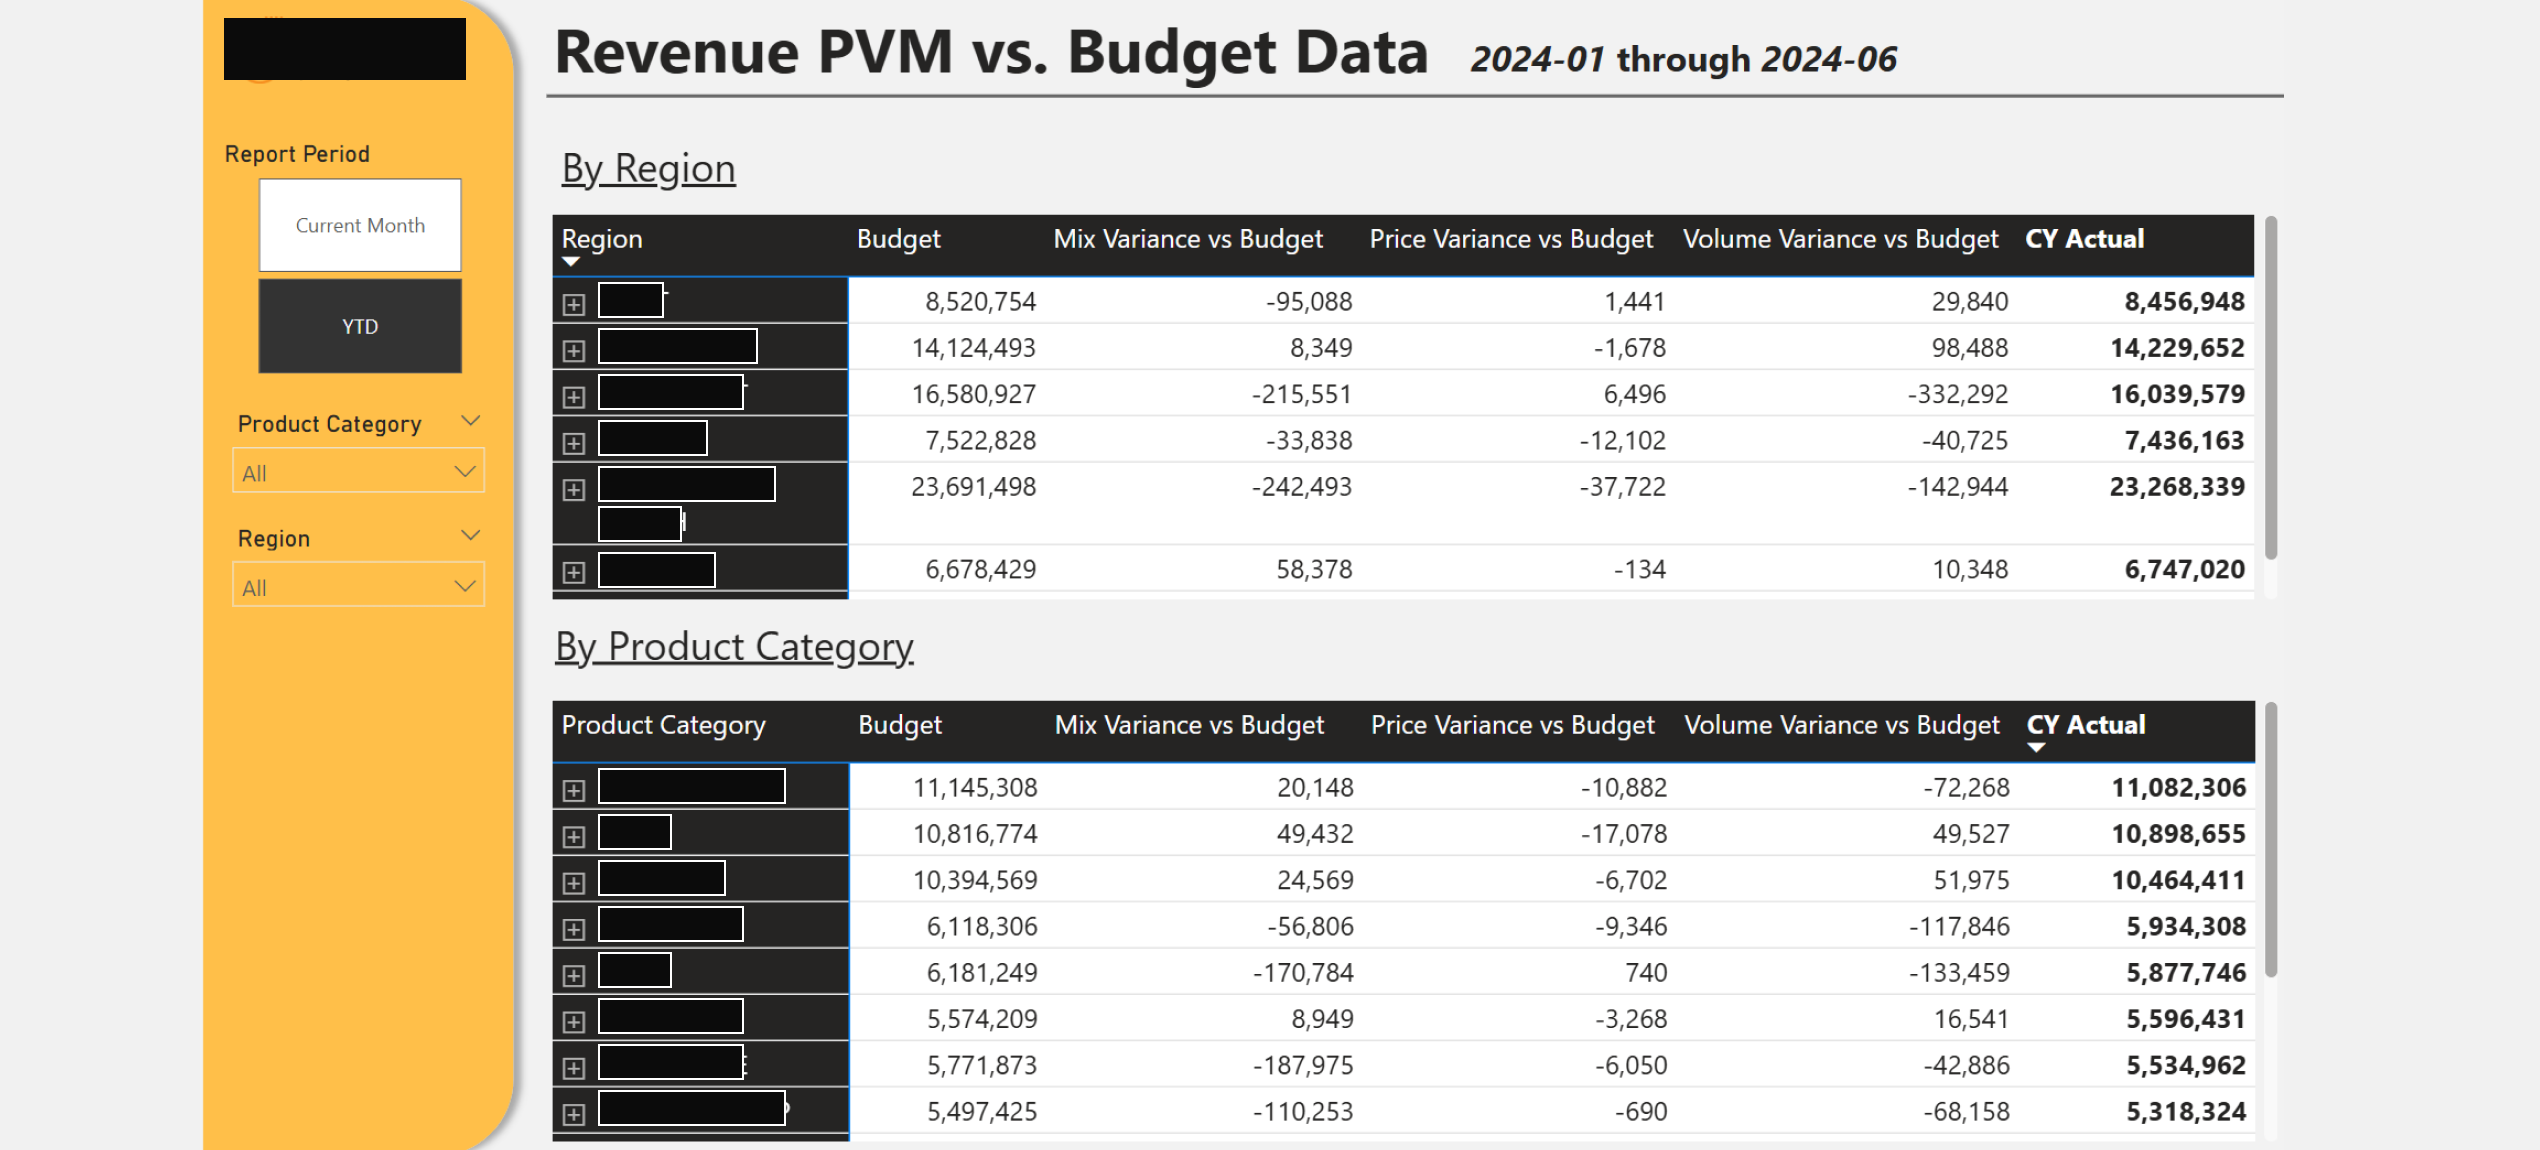
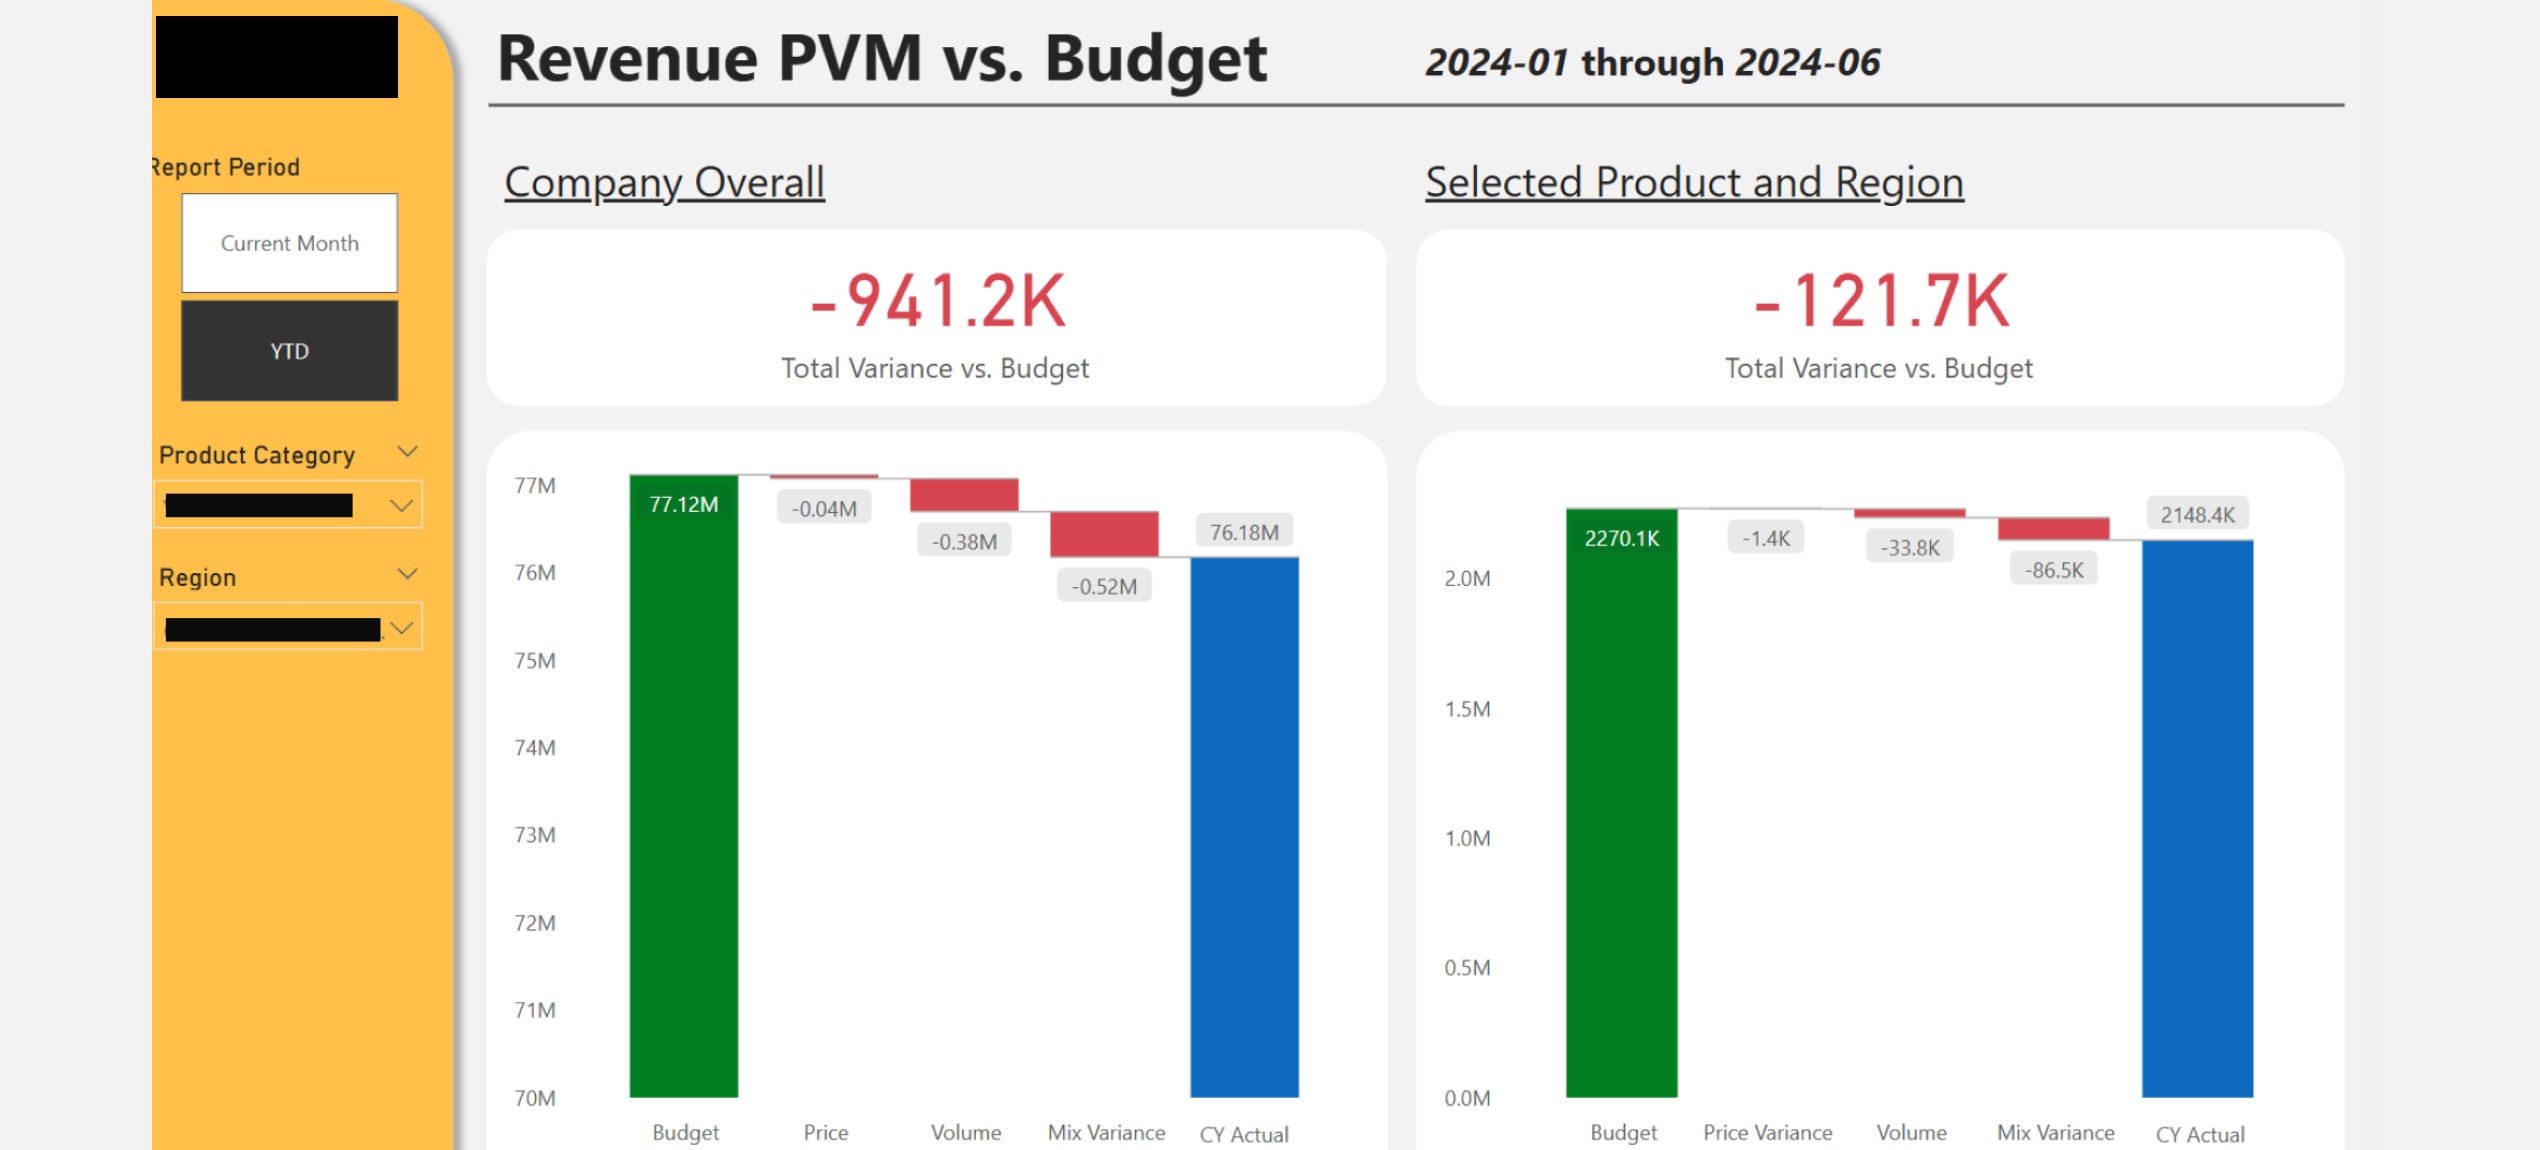
- Revenue PVM analysis: Using the cleaned actuals, the analyst performed a price-volume-mix (PVM) analysis on sales revenue. The budget was set at a product category level (12 product categories encompassing 800+ SKUs), so the PVM was done at that level. This analysis was completed once for the entire company and once for each sales region, to compare actual sales against budget. The PVM step took about 1.5 days of work.
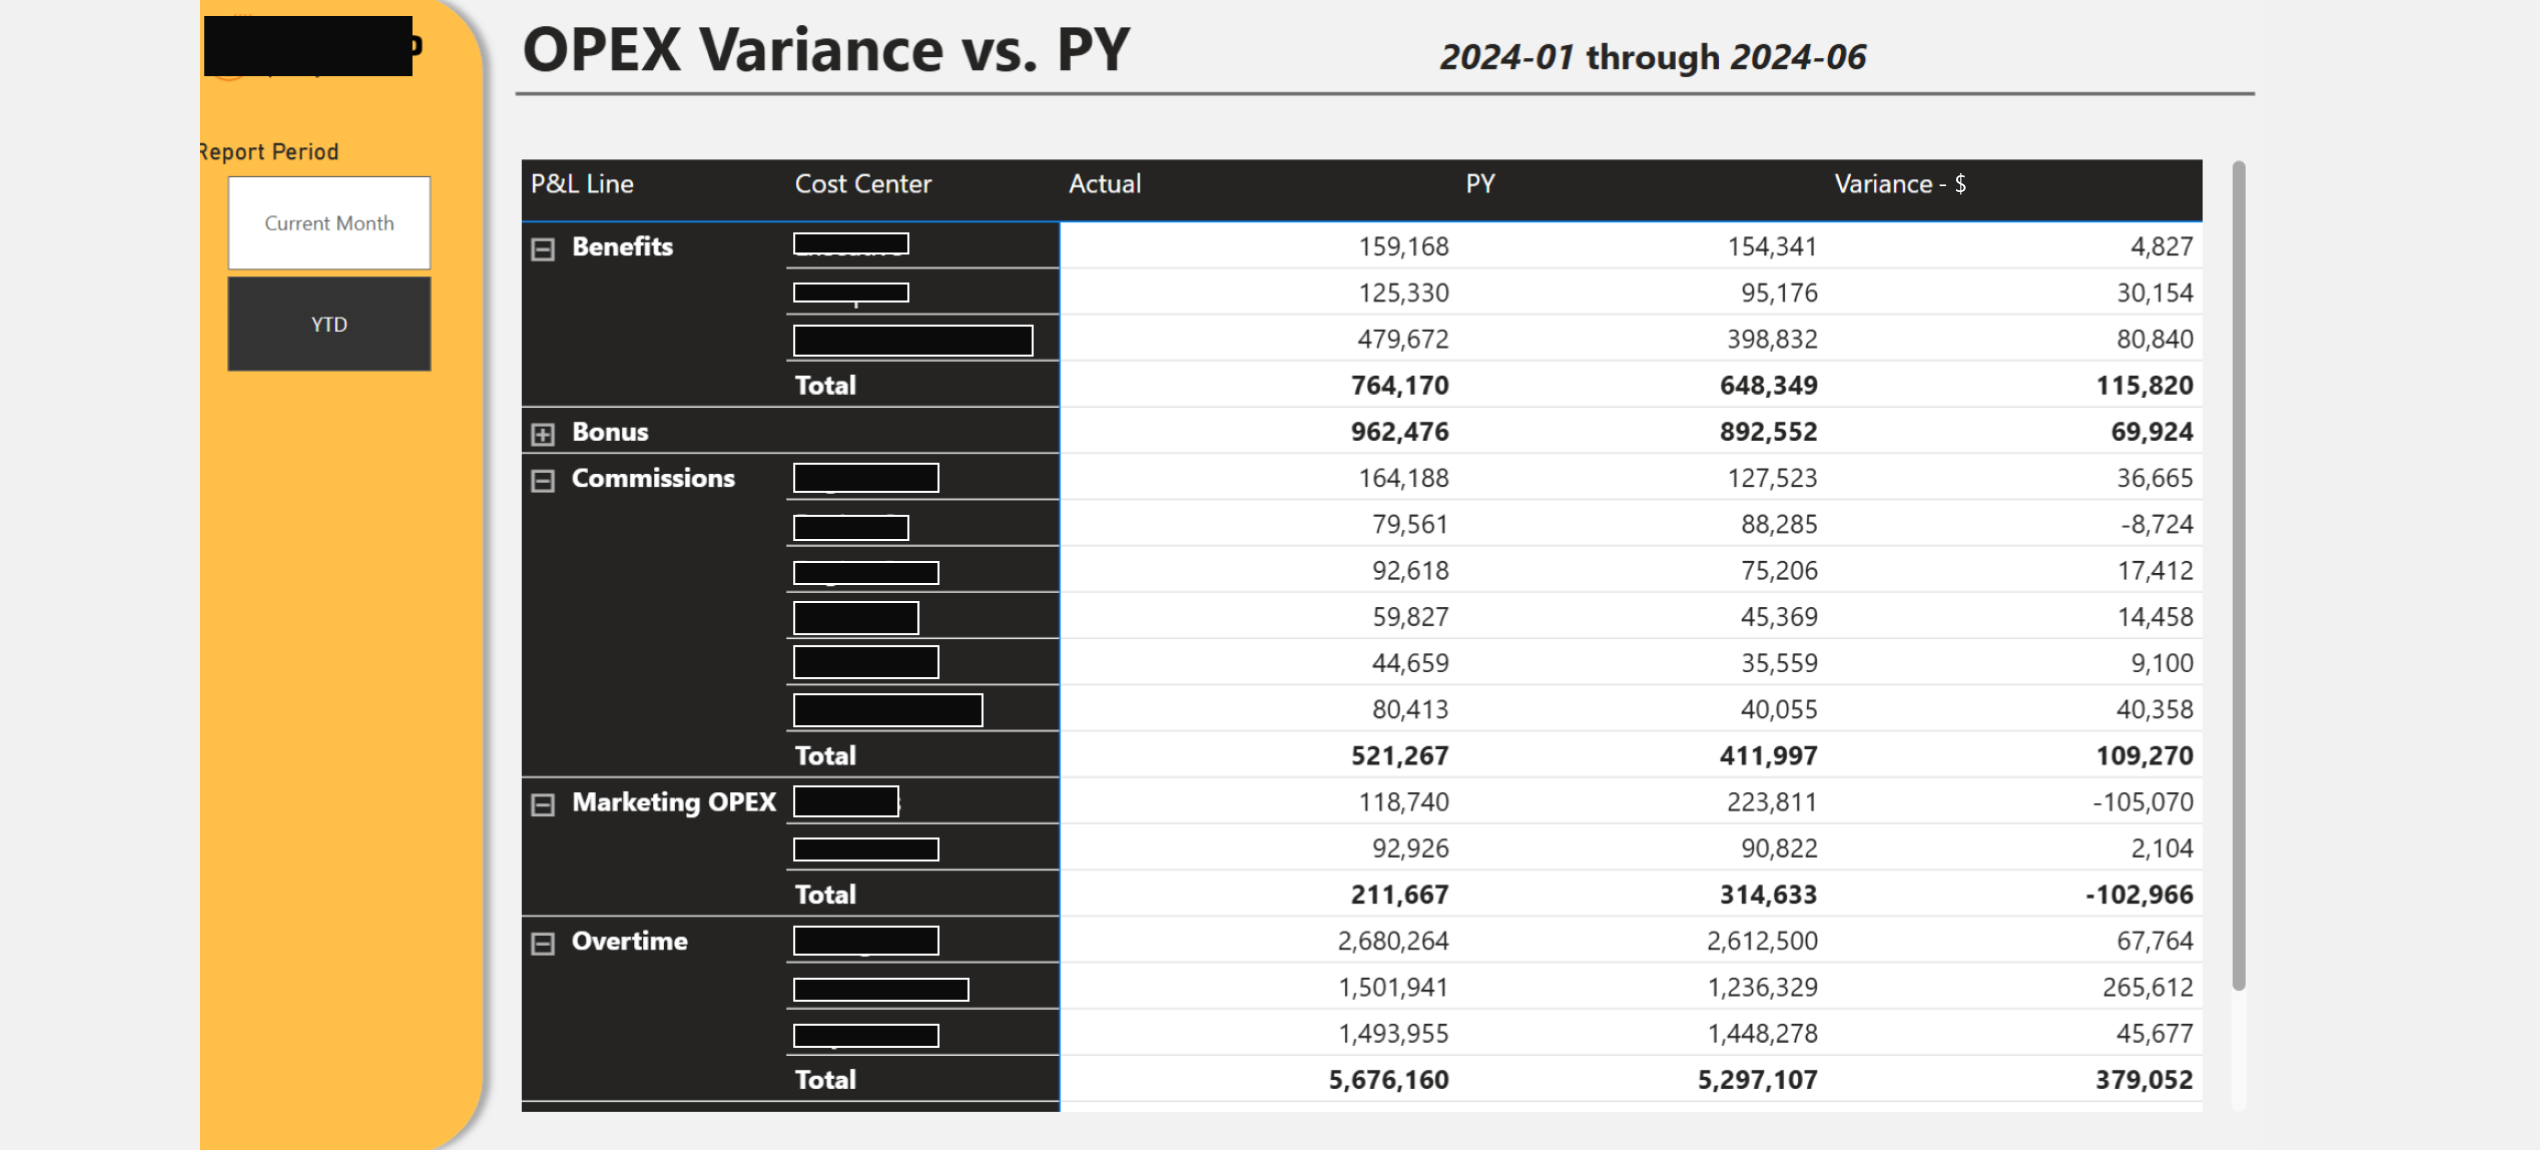
- Operating expense variance: In parallel, the analyst aggregated operating expenses to each budgeted line item (and to each cost center) and calculated actual vs. budget variances for those. This step added another half day of work.
- Prior year comparison: At quarter end, the analyst repeated similar calculations to compare year-to-date actuals against the prior year, producing an additional variance report versus last year. This would normally add an extra day of work.
In Step 2 of the process, the analyst collected explanations for key variances. For any deviations greater than -5% negative or +7.5% positive, he would reach out to the respective department managers or cost center owners for commentary on the drivers. This often required follow-up and sometimes additional analysis (for example, digging into specific transactions or vendor invoices to explain an unusual expense). The commentary would then be summarized for inclusion in the board deck.
The client asked us to automate Step 1 – the data aggregation and variance computation – which was repetitive and time-consuming. By automating the creation of the variance reports, the FP&A analyst would be freed from spending 2.5-3.5 days on manual prep work each month and could instead focus on Step 2: analyzing the results and coordinating the management commentary. The aim was to improve efficiency, reduce the risk of manual errors, and allow the finance team to deliver insights faster for the board reviews.
Project Delivery
Discovery & Analysis
We began with a series of sessions to understand the client’s current variance analysis process. By interviewing the FP&A analyst and examining his Excel workbooks, we documented business rules and nuances that the automation would need to replicate. For example, we learned that the ERP’s unit cost data was not regularly updated (making any gross margin variance unreliable, so the team focused on revenue PVM only). We also discovered certain product codes in the sales data were actually pass-through charges like shipping fees, which the finance team excluded from revenue since the budget didn’t include them. Capturing such nuances was crucial to ensure the automated results matched the analyst’s expectations.
Our review of the Excel models then clarified the PVM formulas used by the business, pinpointed the data sources we would need to build the analysis (the general ledger trial balance for actuals, invoice-level sales transactions data, product master data, and the budget figures) and clarified the granularity at which calculations should occur. Working closely with the finance stakeholders, we finalized the specifications for the automated variance reports. For revenue, the solution would generate PVM variances comparing actual vs. budget at the product category level – one for the whole company and one for each region – and also generate a PVM comparison of actual vs. prior year at a more detailed master-product level (for the company and each region). For operating expenses, the system would compute the variance for each P&L line item (and by cost center) against both budget and prior year. These agreed-upon requirements became the blueprint for our build phase.
Data ELT (Extract, Load, Transform)
We next integrated all required data into a centralized data warehouse. The client’s ERP was Infor SyteLine, from which we needed to extract several key data sets. We set up automated pipelines to pull:
- Trial balance: General ledger account balances (actuals for each P&L line)
- Invoice transactions: Detailed sales invoice records (product IDs, quantities, revenue, and region)
- Product master: The product catalog (each item’s category and master-product grouping)
- Budget: The budget figures (by P&L line and product category, by region)
We collaborated with the IT team to schedule nightly data exports from SyteLine and load them into the data warehouse. We used Azure Data Factory to orchestrate the extraction and loading processes, so that after each month-end close, the latest actuals were in place and ready for the variance calculations.
Variance Calculations Automation
With the data in place, we developed the logic to compute all the variances automatically:
- Mapping & reconciliation: We built in rules to tie the detailed invoices data to the GL revenue. This addressed differences such as timing cut-offs (e.g. invoices straddling month-end) and non-operating items (e.g. freight charges on invoices recorded in separate accounts). We also created a lookup table mapping every GL account to its P&L line item and cost center (mirroring the budget structure). This allowed the actuals to aggregate to the same lines as the budget.
- Revenue PVM calculation: We encoded formulas to break down the revenue variance into Price, Volume, and Mix components:
- Price variance contribution of each product category = (PriceActual – PriceBudget) × Total VolumeBudget × Product Category Mix %Budget
- Mix variance contribution of each product category = (Product Category Mix %Actual – Product Category Mix%Budget) × Total VolumeActual × PriceBudget
- Volume variance contribution of each product category = (Total VolumeActual – Total VolumeBudget) × PriceBudget × Product Category Mix %Budget
- Interaction effect = (Total VolumeActual × Product Category Mix %Actual – Total VolumeBudget × Product Category Mix %Budget) × (PriceActual – PriceBudget) (the residual combined impact, which we later allocated into price/mix/volume based on their respective numerical magnitudes)
- Opex variance calculation: Calculating expense variances was more straightforward. Using the account-to-line mapping, our algorithm summed actual expenses for each P&L line (and cost center) and simply compared them to the budgeted and prior-year values for the same line. This produced a variance amount and percentage for every expense line item, flagging which ones exceeded management’s threshold (i.e. over -5% or +7.5 variance) for further explanation.
Automated Notifications
It was not in the original scope but we helped the client streamline the commentary collection (Step2) as well by setting up an automated email notification system for the OPEX variances. We created a reference table mapping each P&L line item or cost center to the responsible manager’s email. After the variance calculations were updated, the system would flag any line items or cost centers with a variance beyond -5% or +7.5%. Using Microsoft Power Automate, we then automatically sent a templated email to each responsible owner. For example, if the Marketing OPEX was 10% over budget, the Marketing manager would promptly receive an email with the variance details and a request for explanation. These alerts enabled department heads to begin formulating their responses immediately, so by the time the FP&A analyst was finalizing the board deck, many explanations were already in hand.
Outcome
The automation delivered significant benefits:
- Saved ~3 days of manual work per month – roughly 15% of the analyst’s monthly capacity – which could now be redirected to value-added analysis and decision support.
- Reduced reporting cycle by several days – Variance results were available immediately after month-end close, allowing the finance team to finalize the board deck and management commentary several days earlier than before. Stakeholders received timely insights with reduced last-minute scrambling.
- Improved accuracy and consistency by removing manual data manipulation. The automated process ensured one source of truth for actuals vs. budget, eliminating spreadsheet errors and version control issues.