.png)
Power BI vs. Tableau: Which One Should Your Team Use?


FP&A teams in mid-market companies rely on timely, accurate reporting to drive decisions. Most start in Excel for P&L packs, variance bridges, and forecast dashboards. Excel works at first, but as the company grows and the pace of decision making accelerates, it begins to fall short.
That is when many teams turn to Business Intelligence (BI) tools. Power BI and Tableau are the most common choices. Both are excellent platforms, but they are built with different priorities in mind. Choosing the right one can unlock better insights, faster reporting, and smoother collaboration across finance and leadership.
This article compares Tableau and Power BI through the lens of FP&A in mid-market firms. The focus is on the areas that matter most: adoption, learning curve, visualization, setup time, deployment, scalability, ecosystem fit, cost, and practical use cases.
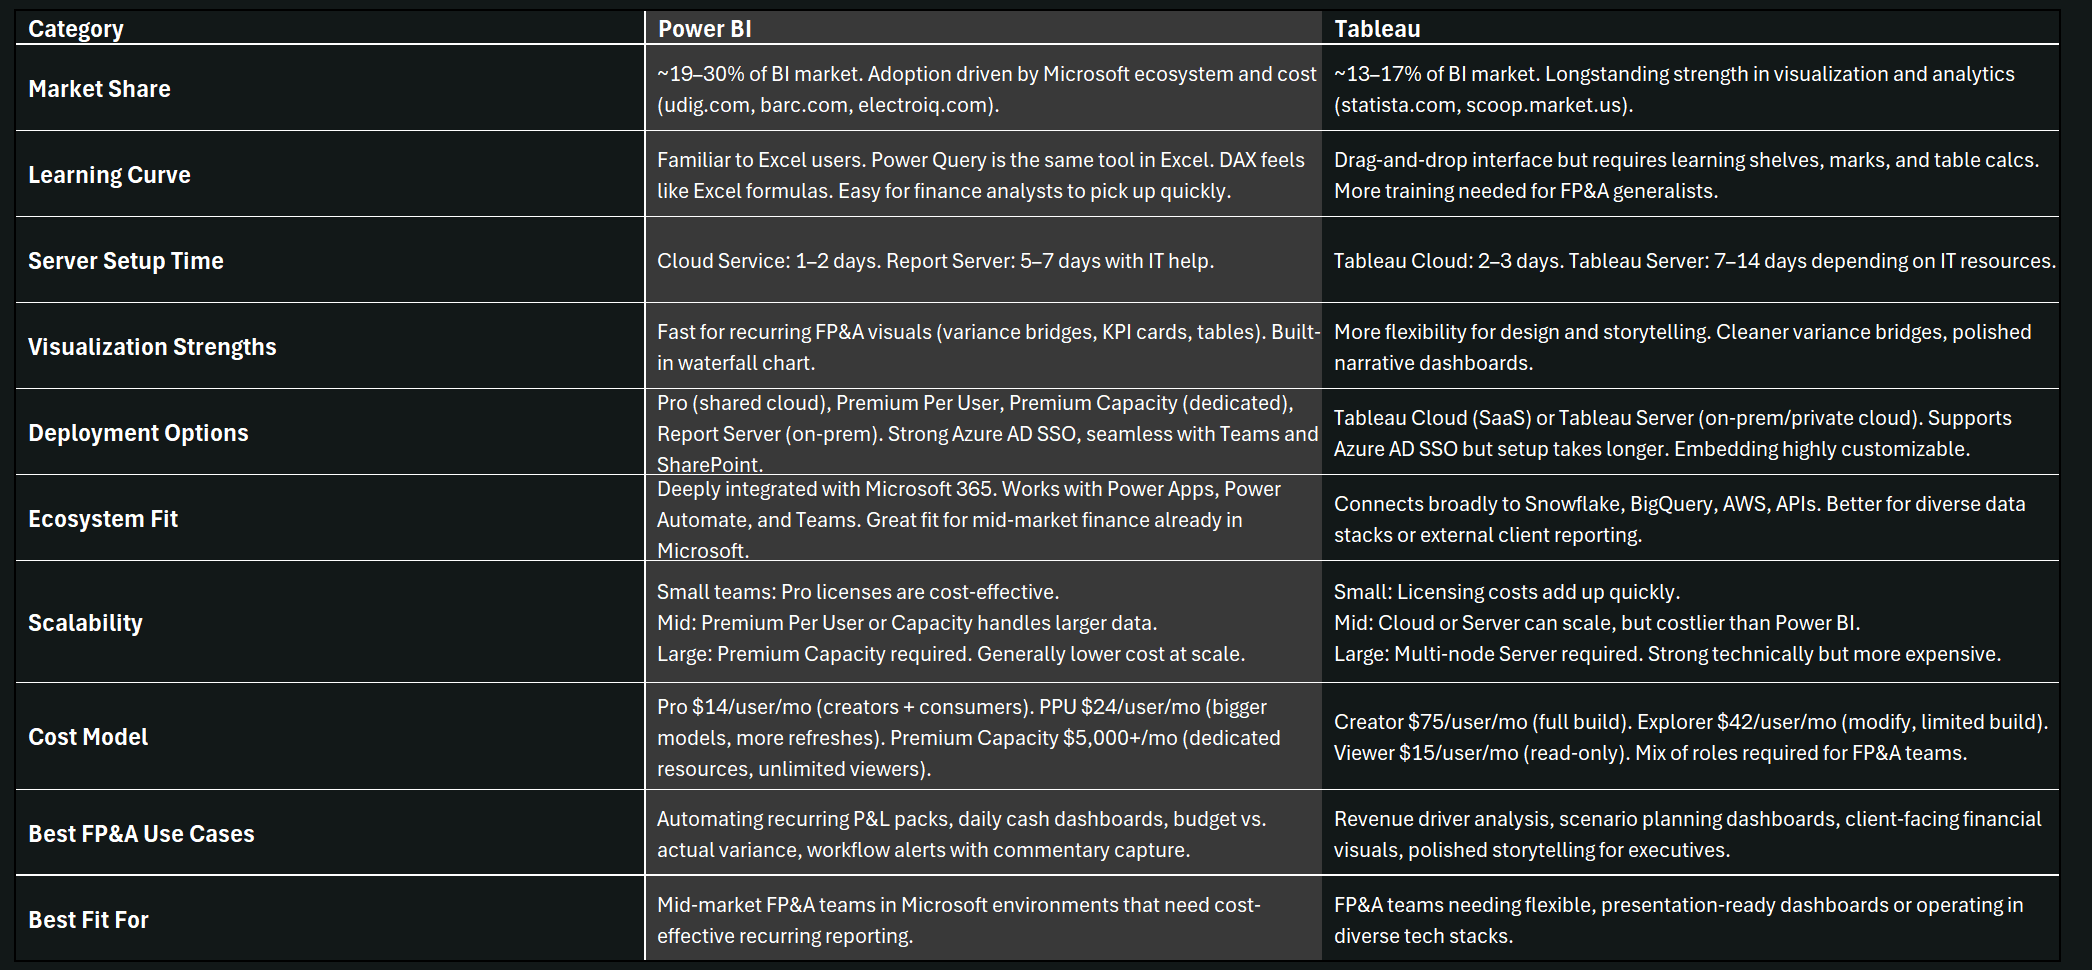
Comparison Summary
Popularity and Adoption
Power BI and Tableau are by far the two most popular BI tools on the market today:
- Power BI holds roughly 19–30% of the global BI market
- Tableau sits between 13–17% depending on the source
These numbers vary because research firms define the BI market differently, but the trend is clear. Power BI has grown rapidly thanks to its integration with Microsoft 365 and attractive pricing, while Tableau remains strong in companies that emphasize advanced analytics and polished visualization. Among our own clients of mid market companies, Power BI has been the preferred choice for ease of learning, fast setup, and low cost.
Ecosystem Fit and Scalability
Power BI in the Microsoft Ecosystem
Power BI extends the Microsoft environment that FP&A teams already know. It integrates tightly with Excel, Power Query, Teams, SharePoint, and Azure. Azure Active Directory provides Single Sign On (SSO), which means finance staff can log in with their corporate credentials instead of separate usernames and passwords.
Power BI also connects to the Power Platform:
- Power Apps embedded inside dashboards allow write-back. For example, managers can add forecast commentary directly into a financial report.
- Power Automate creates workflows from KPI thresholds. For example, an alert can notify finance leaders when SG&A spend rises above 10% of budget.
- Teams integration brings dashboards into daily collaboration channels.
Tableau’s Breadth and Flexibility
Tableau connects naturally to Snowflake, Redshift, BigQuery, and non-Microsoft systems. It is often chosen by firms that do not rely exclusively on Microsoft technology or that need branded, client-facing dashboards. Tableau also supports a large marketplace of extensions and connectors.
SSO is available through Azure AD and other providers, but setting this up is more time consuming than in Power BI.
Scalability by Team Size
For small FP&A teams with fewer than 50 users, Power BI is generally the better fit. A few Pro licenses are enough to cover both report builders and consumers, making it cost effective and simple to manage. Tableau would require a mix of Creator, Explorer, and Viewer roles, which makes even small deployments more expensive.
For mid-sized teams with 50 to 500 users, Power BI often requires Premium Per User or Premium Capacity to handle larger datasets and more frequent refreshes. Tableau Cloud or a modest multi-node Server installation works, but the licensing cost per user is higher. In this range, Power BI usually remains more cost effective, while Tableau is chosen mainly if visualization flexibility is a priority.
For large teams with more than 500 users, both tools need enterprise-level investment. Power BI Premium capacity provides dedicated performance at scale, while Tableau requires larger Server clusters. At this stage both are viable, but Power BI generally keeps a cost advantage in user licensing.
Ease of Learning
FP&A teams live in Excel. That shapes how quickly they can adopt a new tool.
Power BI looks and feels like Excel. Power Query is the same data shaping tool already inside Excel, and DAX formulas are similar to Excel formulas but with more power. From our experience, finance analysts can usually build their first working dashboards in a matter of days.
Tableau relies on drag-and-drop shelves and marks. It feels intuitive for visual thinkers but requires learning how Tableau models data. Analysts must also learn table calculations and Level of Detail expressions. From our experience, FP&A generalists usually need formal training before they can build dashboards on their own.
If your finance team is heavily Excel based, Power BI is easier to adopt. Tableau requires more upfront learning but pays off for teams that value flexibility and advanced visualization.
Ease of Setting Up a Server (in order to publish dashboards)
Speed matters when getting dashboards live.
- Power BI Service (cloud): Publish from Desktop and assign users. Dashboards are live in 1-2 days.
- Power BI Report Server (on-prem): Requires SQL Server licensing and IT help. 5-7 days including domain configuration.
- Tableau Cloud (SaaS): Publish dashboards, assign users, and set up a custom domain if needed. Live in 2-3 days.
- Tableau Server (on-prem or private cloud): Requires configuration of nodes, SSL, and authentication. 7-14 days is typical.
From our experience, FP&A teams with limited IT support prefer Power BI Service or Tableau Cloud. On-prem deployments are only worth it if compliance or data residency rules require them.
Visualization and Customization
FP&A reporting often revolves around a core set of visuals.
- Bar and Line Charts: Power BI creates them quickly for revenue or expense trends. Tableau allows more styling, dual axes, and layered visuals.
- Waterfall or Variance Bridges: Power BI has a built-in Waterfall visual, useful for budget versus actual reporting. Tableau can build more polished bridges, but they require manual setup.
- Tables: Power BI’s matrix supports drill-down, conditional formatting, and subtotals, making it ideal for financial reports. Tableau can produce text tables, but they take more formatting work.
- KPI Cards: Power BI includes KPI visuals with thresholds and arrows out of the box. Tableau requires calculated fields and icons, but allows more custom design.
For recurring FP&A packs, Power BI is usually faster. Tableau is stronger when reports need to double as polished presentations.
Deployment, Sharing, Embedding, and SSO
Power BI
- Pro (cloud, shared capacity): Each licensed user can build and publish dashboards. Best for small teams and straightforward reporting.
- Premium Per User (PPU): Adds larger model sizes, faster refreshes, and advanced features such as paginated reports. Useful for mid-sized FP&A teams with more data.
- Premium Capacity: Provides dedicated cloud resources. Best for larger FP&A teams that want predictable performance at scale and wide distribution without per-user licensing.
- Report Server (on-prem): For companies that must host dashboards internally due to compliance.
Sharing in Power BI happens through Apps and Workspaces. Embedding in Teams, SharePoint, or custom apps is straightforward. SSO through Azure AD means finance staff log in with corporate credentials without managing extra passwords.
Tableau
- Tableau Cloud: A SaaS deployment that is fast to set up and now allows custom domains. Best for FP&A teams that want ease of use and do not want to manage servers.
- Tableau Server: Deployed on-premise or in a private cloud. Offers full control including vanity domains and custom authentication. Often chosen when companies need specific governance or data residency controls.
Tableau sharing happens through Projects with role-based access. Embedding dashboards in portals or branded sites is well supported. Azure AD SSO works, but setup is more time consuming than in Power BI.
Use Cases for FP&A in Mid-Market Firms
Power BI: Operational Reporting
- Monthly P&L Packs: Automated from ERP and refreshed daily. Distributed through Teams.
- Variance Analysis: Budget versus actuals with waterfall visuals. Conditional formatting to highlight risks.
- Cash Flow Reporting: Daily dashboards tied to bank or ERP data to monitor liquidity.
- Workflow Integration: Alerts fire when KPIs breach thresholds. Managers can add commentary directly in dashboards through Power Apps.
Tableau: Analytical Storytelling
- Revenue Driver Analysis: Explore variance by product, customer, or region.
- Scenario Planning: Interactive dashboards let executives adjust assumptions and see results in real time.
- Client-Facing Dashboards: Polished and branded dashboards for external audiences.
- Narrative Dashboards: Guides leadership through financial performance with a story flow.
Cost Considerations
Power BI Licenses
- Pro ($14/user/month): Full dashboard building and sharing. Best for analysts and report creators.
- Premium Per User ($24/user/month): Larger models, higher refresh frequency, and advanced features. Best for power users or analysts working with complex FP&A data.
- Premium Capacity ($5,000+/month): Dedicated performance and unlimited viewers without per-user licenses. Best for large finance teams or enterprise reporting.
Tableau Licenses
- Creator ($75/user/month): Full capability for building and publishing dashboards. Needed for core FP&A developers.
- Explorer ($42/user/month): Can interact with and modify dashboards. Best for department managers or analysts who need limited building capability.
- Viewer ($15/user/month): Read-only access to dashboards. Best for executives or managers consuming reports.
Example for a 50-person FP&A team:
- Power BI: 5 creators + 45 Pro viewers = about $700 per month.
- Tableau: 5 creators, 10 explorers, and 35 viewers = about $3,300 per month.
Power BI is usually more cost effective in mid-market FP&A settings. Tableau is more expensive but worth it for teams that need client-facing dashboards or advanced storytelling.
In Summary
Power BI is stronger for FP&A teams that:
- Rely on Microsoft tools such as Excel, Teams, and SharePoint.
- Need recurring reports automated and shared widely.
- Value quick adoption and cost efficiency.
Tableau is stronger for FP&A teams that:
- Need advanced visual storytelling.
- Rely on diverse data sources beyond Microsoft.
- Require polished dashboards for external stakeholders.
The best way to choose is to run a pilot in both tools using a real FP&A case, such as a monthly variance dashboard. Compare how quickly you can get insights, how widely you can distribute reports, and how well your team adopts the tool.